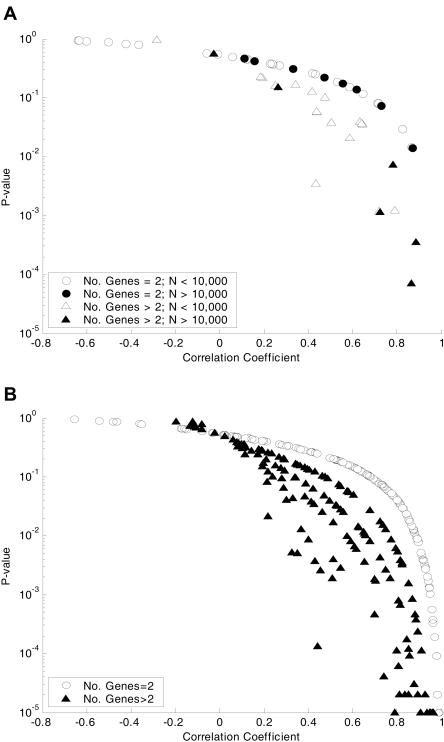
Figure 4.
Correlation of genes in correlated reaction sets and transcription units based on expression data. The average correlation coefficients between genes associated with reactions in correlated reaction sets was calculated using a set of publicly available (ASAP) expression data from 20 different conditions. The calculated average correlation coefficients and their corresponding P-values are plotted in A (six of the two reaction sets were omitted from the graph because at least one of the reactions had no associated genes). Circles are used to denote small sets (only two genes with expression data), and triangles are used to denote larger sets (greater than two genes with expression data); open shapes are used for sets that are used in less than 10,000 optimal solutions, and filled shapes are used for sets used in more than 10,000 optimal solutions. (B) shows average correlation coefficients between genes on the same transcription unit (Karp et al. 2002) using the same set of expression data. Open circles are used to denote small sets (only two genes with expression data) and solid triangles to denote larger sets (greater than two genes with expression data).

