
Fig. 1.
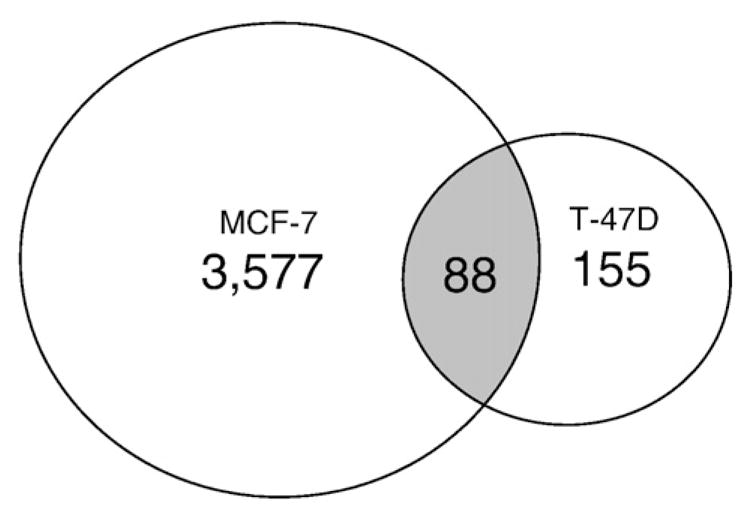
ERα-bound regions in T-47D cells. Comparison of the ERα-bound regions identified in the current study (T-47D) with those reported in a genome-wide analysis in MCF-7 cells [27]. As shown in the Venn diagram 88 of the 243 regions identified in our study overlapped with at least 50% sequence identity to those reported previously [27].