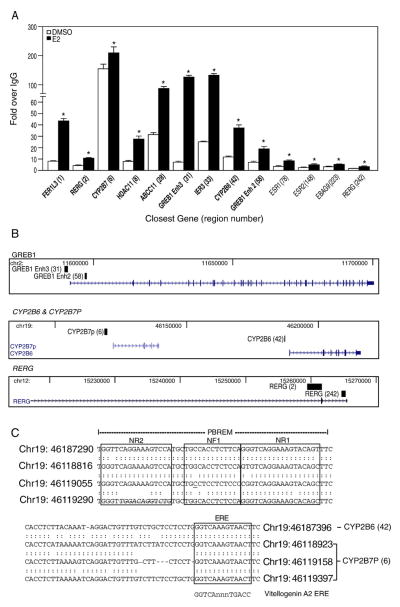
Fig. 2.
Confirmation of ERα-bound regions identified in the ChIP-chip study. (A) Conventional ChIP was performed to confirm 13 ERα-bound regions in T-47D plated in DCC-FBS containing medium and treated with E2 for 1 h. These 13 regions were chosen to represent a range of enriched values from the array. ERα recruitment level significantly (p<0.05 Student’s t-test) different from DMSO is indicated by an asterisk for each region. Regions shown in bold font indicate the presence of at least one estrogen response element in the sequence. (B) Selected ERα-bound regions relative to their closest genes are shown using USCS Genome Browser (http://genome.ucsc.edu/). The black blocks represent ERα-bound regions identified from our ChIP-chip study, whereas the arrows indicate the transcriptional direction of the closest annotated genes. (C) The diagram shows the genomic coordinates and the sequences of the putative EREs are boxed in CYP2B7P (6) and CYP2B6 (42) and the phenobarbital-responsive enhancer module (PBREM). Nuclear receptor 1 (NR1) and NR2 represent two direct repeat 4 (DR4) nuclear receptor motifs, which are boxed, while NF1 denotes a putative nuclear factor 1 binding site as previously described [18]. The perfect palindromic ERE from vitellogenin A2 is also shown for comparison. A colon indicates homology among the sequences, where an underline indicates nucleotide differences among the sequences at that position.

