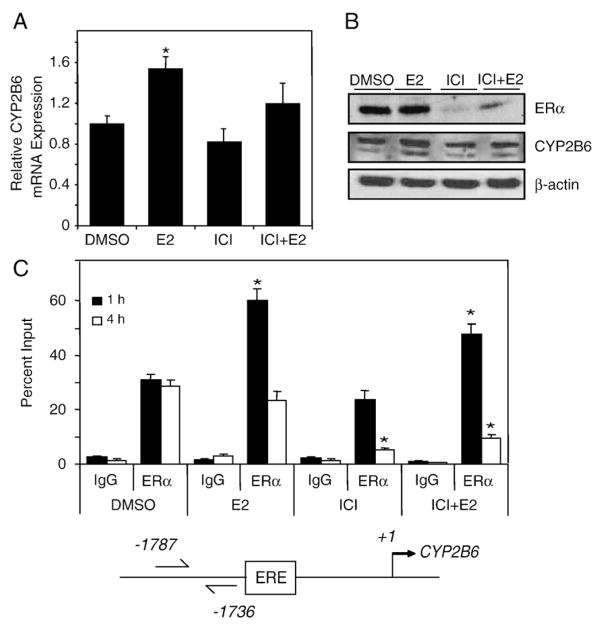
Fig. 5.
E2-dependent regulation of CYP2B6 expression in T-47D cells. T-47D cells were plated in DCC-FBS containing medium for 72 h before treatment. (A) After 6 h treatment with 0.1% DMSO, 10 nM E2, 100 nM ICI 182,780, or 10 nM E2+100 nM ICI 182,780, RNA was isolated and CYP2B6 expression level was analyzed by qPCR as described in Materials and methods. Expression level significantly (p<0.05 one-way ANOVA) different from DMSO is indicated by an asterisk. Results shown are means±S.E.M. for three independent experiments. (B) T-47D cells were treated with 0.1% DMSO, 10 nM E2, 100 nM ICI 182,780, or 10 nM E2+100 nM ICI 182,780 for 24 h before western analysis. Images shown are representative of two independent experiments. (C) ChIP assays were performed in T-47D cells treated with 0.1% DMSO, 10 nM E2, 100 nM ICI 182,780, or 10 nM E2+100 nM ICI 182,780 for the time points indicated. Results shown are means±S.E.M. for three independent experiments. Recruitment levels are presented as a percentage of a 5% total chromatin input. Recruitment level significantly (p<0.05 one-way ANOVA) different from time-matched DMSO is indicated by an asterisk.

