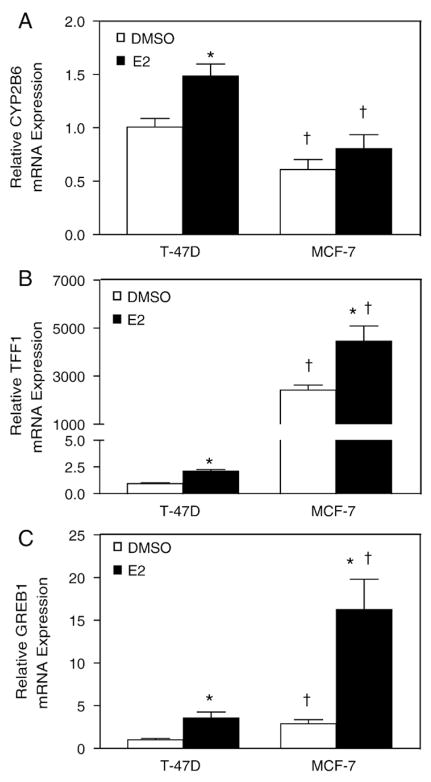
Fig. 7.
Differential expression of TFF1 and CYP2B6 in T-47D and MCF-7 after E2 stimulation. T-47D and MCF-7 cells were plated in DCC-FBS containing medium for 72 h before treatment. After 6 h treatment with 0.1% DMSO or 10 nM E2, RNA was isolated and the expression of (A) CYP2B6, (B) TFF1, and (C) GREB1 was analyzed by qPCR as described in Materials and methods. Statistical significance (p<0.05 Student’s t-test) between treatment groups from the same cell line is indicated by an asterisk. Statistical significance (p<0.05 Student’s t-test) between cell lines with the same treatment is indicated by a dagger. Results shown are means±S.E.M. for three independent experiments.

