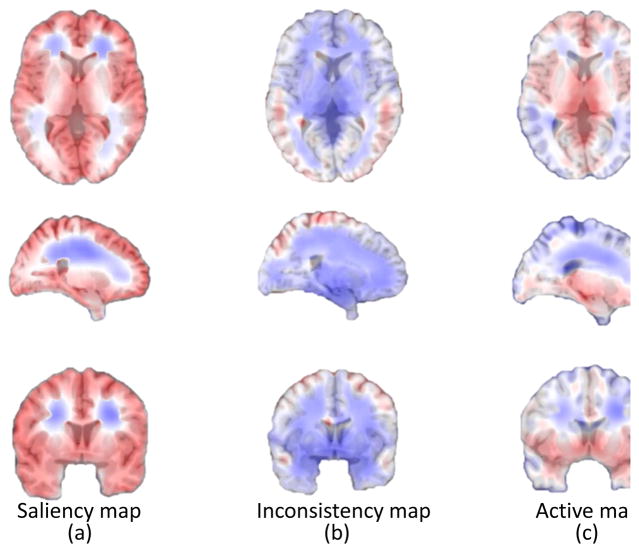
Fig. 3.
Saliency, inconsistency and active maps. Each map is linearly stretched to [0,1] for clear visualization. (a) Saliency map, where regions with larger values are more salient than those with smaller ones. (b) Inconsistency map, where regions with larger values are more inconsistent than those with smaller ones. (c) Combined active map, where regions with larger values are more active than those with smaller ones.

