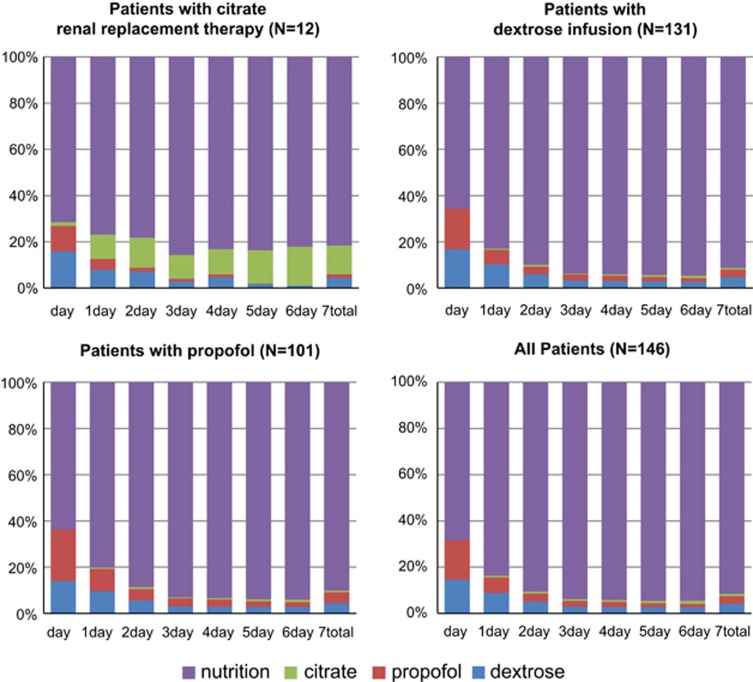
Figure 1.
Proportions of nutritional and NNCs in the first 7 days of ICU admission. On the X axis, the day of ICU admission and the total of the first 7 days of admission, and on the Y axis, the calories from dextrose (blue), propofol (red), citrate (green) and nutrition (purple) of the total calories.

