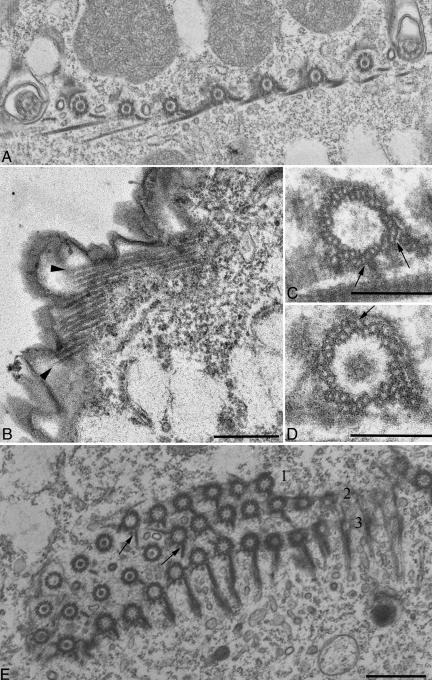
Figure 5.
TEM analysis of the βDDDE440 mutant cortex. Cells were obtained by conjugation of mutant heterokaryons, and mutant chains at the two-subcell stage were hand picked and prepared for TEM (A) Longitudinal section showing dense packing of BBs. (B) An LM bundle showing profiles of 14 MTs. (C and D) Cross sections through the BBs. Arrows point to abnormal additional MTs associated with the triplets. (E) Cross section of an OA. The membranelles of the AZM show overgrown PC ribbons (arrows) in the first and second row. The AZM rows are labeled 1, 2, and 3, respectively.

