Figure 8.

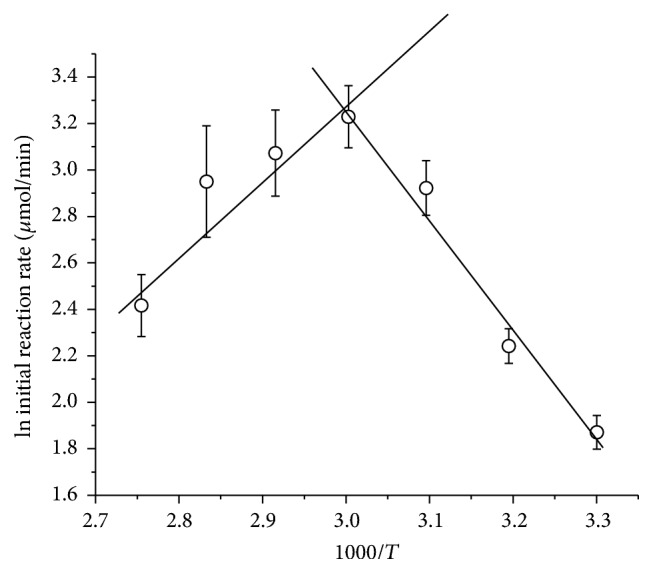
Arrhenius plot to calculate the activation energy (Ea) and optimum temperature of pure exo-PG from R. pusillus. The average (symbols) and standard deviations (bars) are reported in the graph.

Arrhenius plot to calculate the activation energy (Ea) and optimum temperature of pure exo-PG from R. pusillus. The average (symbols) and standard deviations (bars) are reported in the graph.