Figure 1.

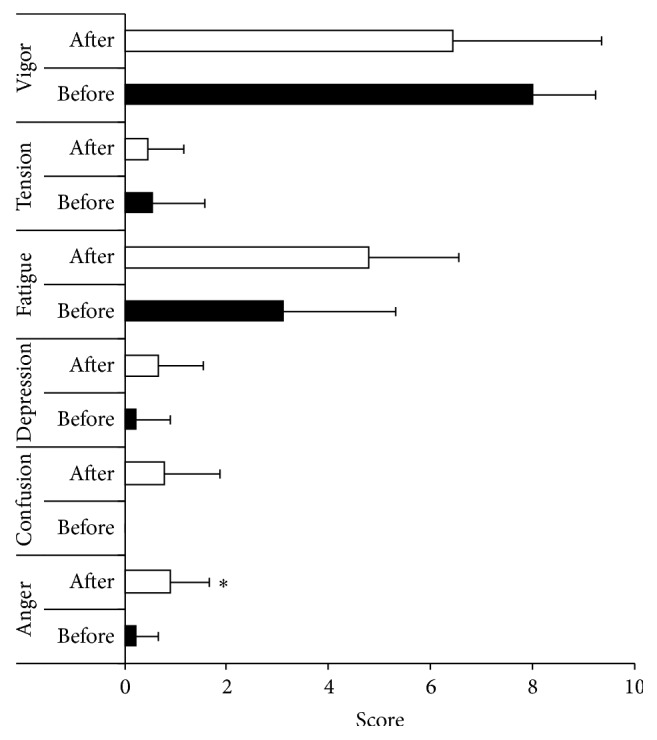
Mood state before and after fasting. Data are presented as mean (standard deviation). ∗ p < 0.05, compared with before fasting.

Mood state before and after fasting. Data are presented as mean (standard deviation). ∗ p < 0.05, compared with before fasting.