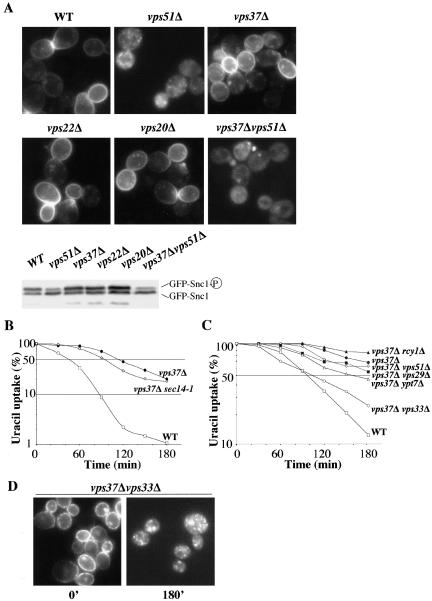
Figure 6.
Fur4p and Snc1p follow different recycling roads. (A) BY4741 (WT), yJMG453 (vps51Δ, VFT), yJMG408 (vps37Δ, ESCRT I), yJMG475 (vps22Δ, ESCRT II), yJMG400 (vps20Δ, ESCRT III), and yJMG531 (vps37Δvps51Δ, ESCRT I, VFT) cells were transformed with pJMG118 (tpi-GFP-Snc1) and cultured until the early exponential growth phase. The subcellular distribution of GFPSnc1p was monitored by fluorescence microscopy (top). Crude extracts were prepared and the phosphorylation state of GFP-Snc1p was checked by Western immunoblotting in the indicated strains (bottom). (B) BY4741 (WT, white square), yJMG524 (vps37Δsec14-1, white diamond), and yJMG408 (vps37Δ, black circle) transformed with pFL38gFP (GAL-Fur4-GFP) were grown at 24°C and preshifted at 37° 15 min before addition of rapamycin. Uracil uptake was measured every 30 min after the addition of rapamycin over a 3-h period; results are expressed as a percentage of the initial uptake at t = 0 in a semilog scale. (C) yJMG528 (vps37Δrcy1Δ, black triangle), yJMG530 (vps37Δypt7Δ, white triangle), (yJMG531 (vps37Δvps51Δ, white diamond), yJMG529 (vps37Δvps29Δ, black square) and yJMG523 (vps37Δvps33Δ, white circle) cells were transformed, cultured, induced, and treated with rapamycin as described in Figure 3. The curves from Figure 3A corresponding to BY4741 (WT, white square) and yJMG408 (vps37Δ, black circle) transformed with pFL38gFP (GAL-Fur4-GFP) are replotted here. (D) yJMG523 (vps37Δvps33Δ) cells were collected at the time indicated after the addition of rapamycin and visualized by fluorescence microscopy. Note that Fur4-GFP accumulated in intracellular dots at t = 180′ (compare with Figure 3B).

