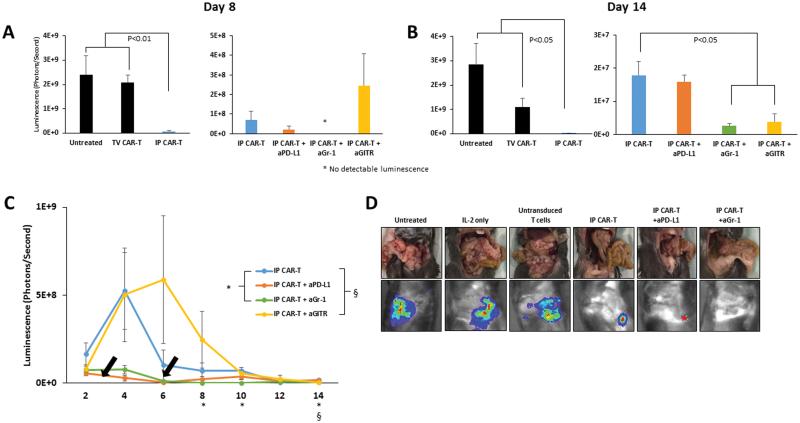
Figure 5. IP CAR-Ts in combination with suppressor cell targeting for in vivo treatment.
IP CAR-Ts combined with depleting antibodies against MDSC and Treg, or blocking antibodies against the PD-L1 pathway, were administered to mice injected with MC38CEA-luc. Tumor reduction was monitored by bioluminescence over 14 days. Bar graphs compare the efficacy of regional IP CAR-Ts to systemic TV CAR-Ts, and IP CAR-Ts alone to IP CAR-Ts with antibodies on day 8 after the treatments (A) and at the end of the study on day 14 (B). Bars are representative of 4 animals per group. Black arrows represent CAR-T treatments. Symbols denoting significance appear for specific days below the x axis (C). Gross inspection images, as well as bioluminescence images, are shown for all groups on day 14 (D). Error bars are representative of SEM values. P values were calculated using Student’s t test.

