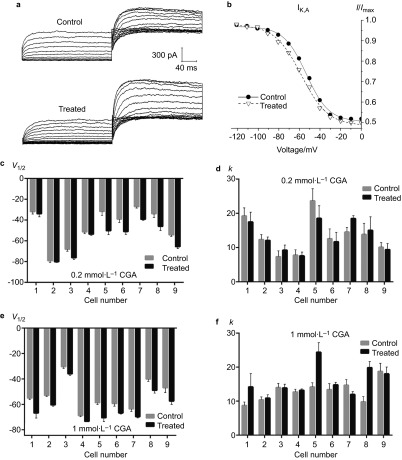
Figure 6.
The effects of 0.2 and 1 mmol⋅L−1 CGA on IK,V inactivation. (a) Typical examples of IK,V inactivation in the 0.2 mmol⋅L−1 CGA and control groups. (b) Normalized inactivation curves of IK,V in the 0.2 mmol⋅L−1 CGA and control groups. (c, d) Comparison of the fitted results of the IK,V inactivation currents between the 0.2 mmol⋅L−1 CGA and control groups. (e, f) Comparison of the fitted results of the IK,V inactivation currents between the 1 mmol⋅L−1 CGA and control groups. CGA, chlorogenic acid.

