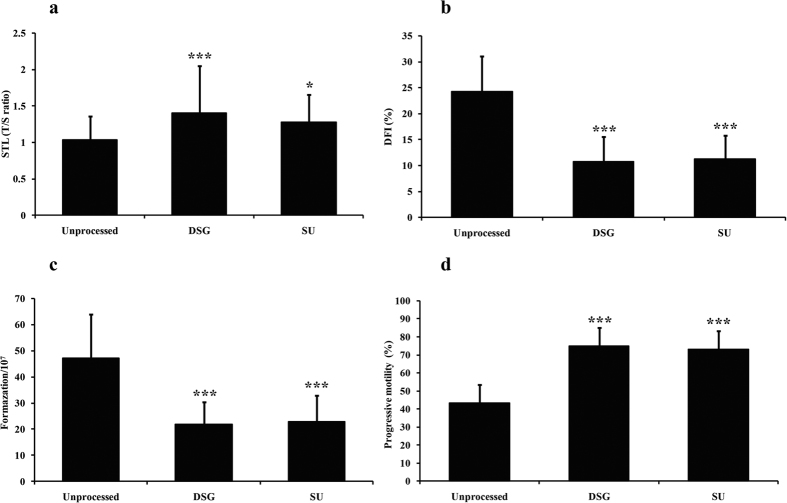
Figure 1. Comparison of the STL, DFI, ROS content and progressive motility before and after the processing methods.
(a) Comparison of the STL among the three groups. (b) Comparison of the DFI among the three groups. (c) Comparison of the ROS content among the three groups. (d) Comparison of progressive motility among the three groups. *P < 0.05 compared to unprocessed sperm; ***P < 0.001 compared to unprocessed sperm. DFI, DNA fragmentation index. N = 150, One-way ANOVA and LSD-t test.

