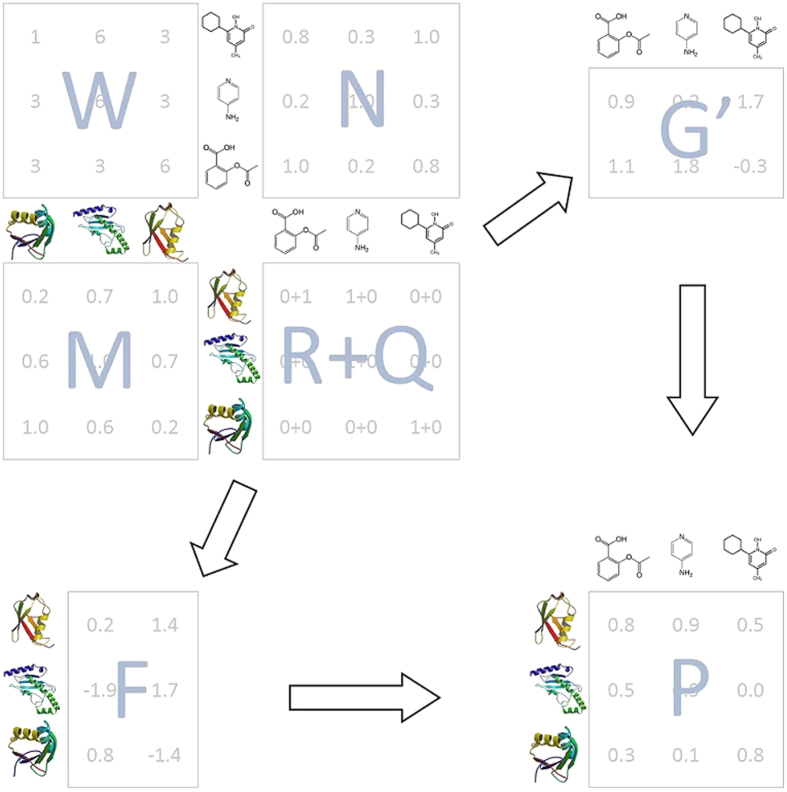
Figure 1. The components of the loss function.
INPUT: the sum of the interaction and impute matrices R + Q; the weight matrix W; the protein similarity matrix M; the chemical similarity matrix N. OUTPUT: the matrix of protein latent preferences F; the matrix of chemical latent preferences G; the matrix of predicted interaction probabilities  .
.

