
Figure 1.
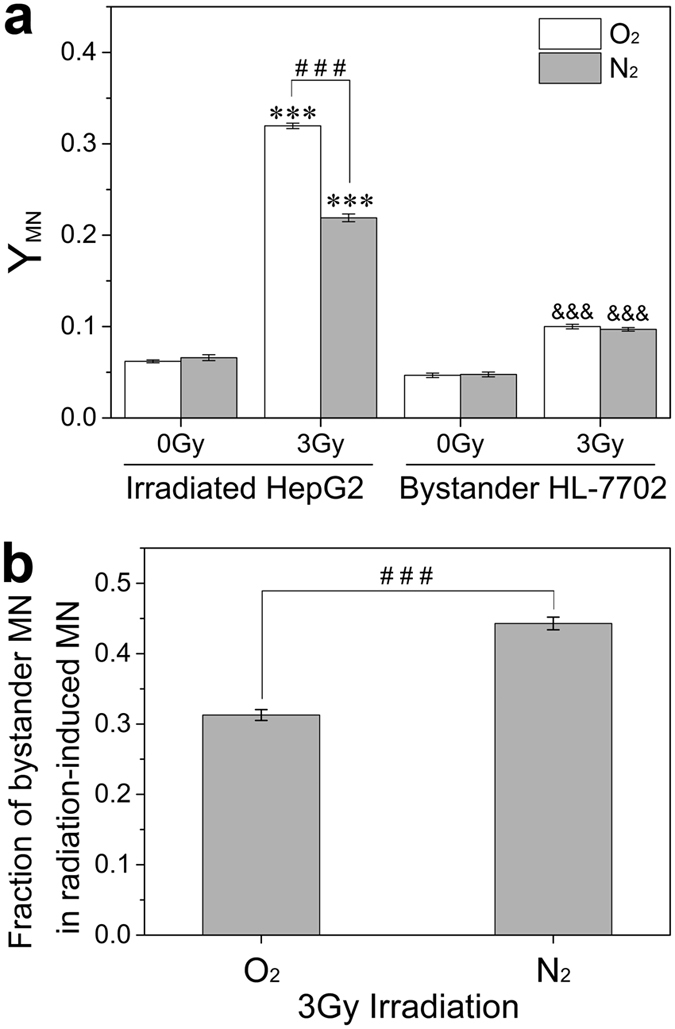
The yields of MN (YMN) in irradiated HepG2 cells and bystander HL-7702 cells at different oxygen status (a) and the ratio of bystander MN of HL-7702 cells to the radiation-induced MN of hepatoma cells at different oxygen status (b). ***P < 0.001 compared to non-irradiated control of HepG2 cells; &&&P < 0.001 compared to non-irradiated control of HL-7702 cells; ###P < 0.001 between the indicated groups.