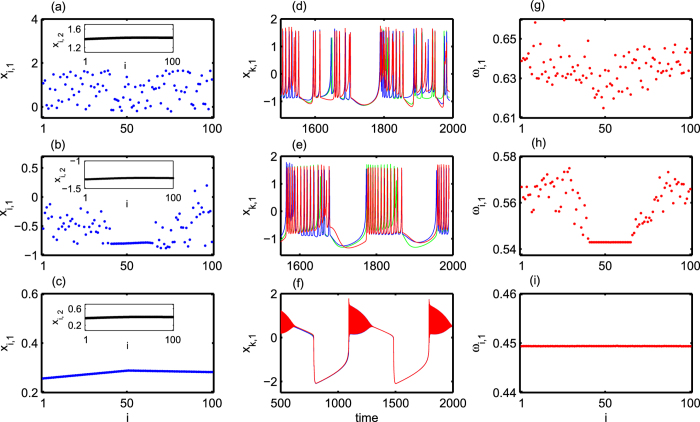
Figure 2.
Left panels show snapshots of membrane potentials xi,1(i = 1, 2, …, 100) for (a) disordered state, Kch = 1.0, (b) chimera state, Kch = 1.130, and (c) coherent state, Kch = 1.30. Middle panels show the behaviors of the neurons xk,1(k = 20, 50, 90) in the upper layer for (d) disordered, (e) chimera, and (f) coherent states. Right panels show corresponding mean angular frequencies ωi,1(i = 1, 2, …, 100) for (g) disordered, (h) chimera and (i) coherent states. The inset figures in (a), (b) and (c) are the corresponding snapshots of the lower layer neurons’ membrane potentials xi,2(i = 1, 2, …, 100) (black color), that signify coherent state of the neurons.

