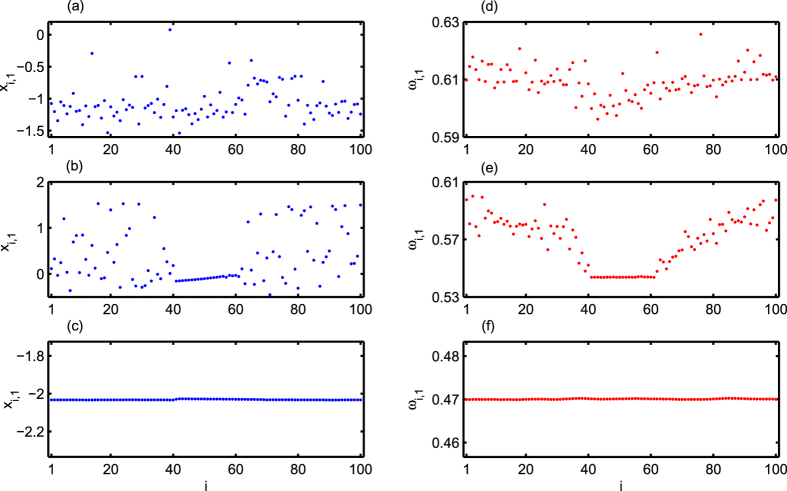
Figure 5.
Left panels show snapshots of membrane potentials for (a) disordered state at Kch = 0.43, (b) chimera state at Kch = 0.73, and (c) coherent state at Kch = 1.10. Right panels (d), (e), and (f) show the corresponding mean angular frequencies of disordered, chimera and coherent states. The homogeneous inter-later synaptic coupling delay-time τ = 0.4.

