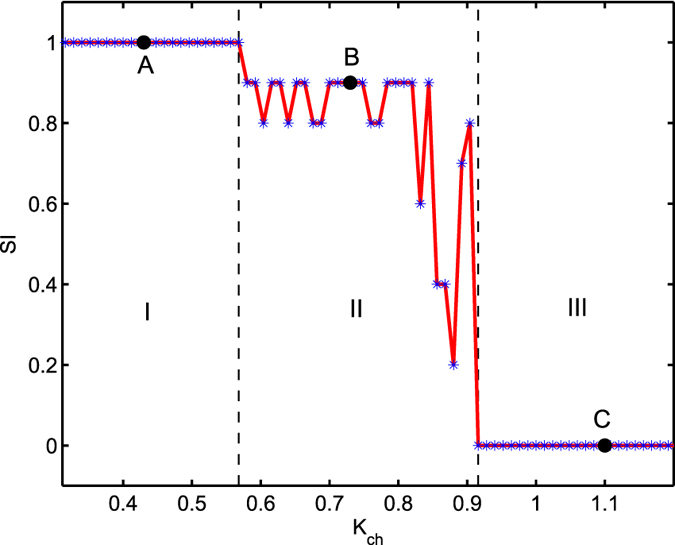
Figure 6. Strength of incoherence is plotted against inter-layer chemical synaptic coupling strength Kch for τ = 0.4. Regions I, II and III respectively stand for disordered, chimera and coherent states.

The values pointed as A (at Kch = 0.43), B (at Kch = 0.73) and C (at Kch = 1.10) correspond to the exemplary snapshots given in Fig. 5(a,b and c) respectively.
