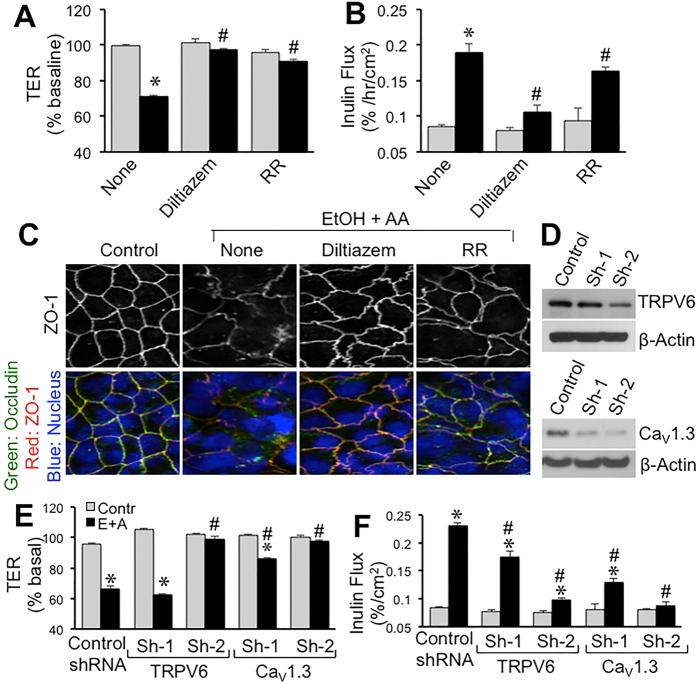
Figure 5. Ca2+ channels play role in ethanol and acetaldehyde-induced disruption of tight junctions and barrier dysfunction.
(A–C) Caco-2 cells were preincubated with diltiazem (30 μM) or ruthenium red (RR; 30 μM) 30 min prior to incubation with acetaldehyde (200 μM) in the presence of 75 mM ethanol (closed bars; EtOH+AA) or without acetaldehyde or ethanol treatment (gray bars). At 4-hour incubation, TER (A) and unidirectional flux of FITC-inulin (B) were measured. Fixed cell monolayers were stained for occludin (green) and ZO-1 (red) by immunofluorescence method (C). Values are mean ± SEM (n = 6). Asterisks indicate values that are significantly different from corresponding values for control cell monolayers (gray bars). Hash tags indicate values that are significantly different from corresponding values for “None” group. (D–F) Caco-2 cells were transfected with either of two different shRNA (Sh1 and Sh2) each for CaV1.3 and TRPV6 or control shRNA and down regulation of specific channels was confirmed by immunoblot analysis for corresponding channels (D). Transfected cell monolayers were treated with 100 mM ethanol followed by 200 μM acetaldehyde. TER (E) and inulin permeability (F) were measured. Values are mean ± SEM (n = 6). Asterisks indicate the values that are significantly different from corresponding control values (gray bars). Hash tags indicate values that are significantly different from corresponding values for “Control shRNA” group.

