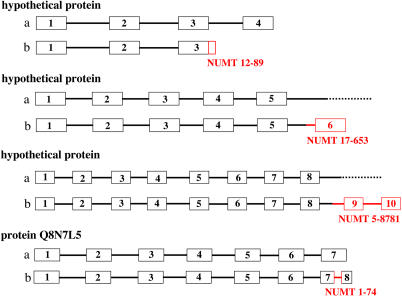
Figure 6. Scheme Representing Some NUMT Insertions in Genes.
Four known or predicted genes, found in loci with NUMT insertion in humans, have been schematically represented either in the absence (A) or in the presence (B) of the insertion. Boxes represent exons, and thick lines represent introns. Red boxes and lines indicate the sequence corresponding to the NUMT, which has been identified for each case. A dotted line in (A) indicates that, in the absence of insertion, the exon/intron pattern was not identified by gene identification programs. Representation not to scale.

