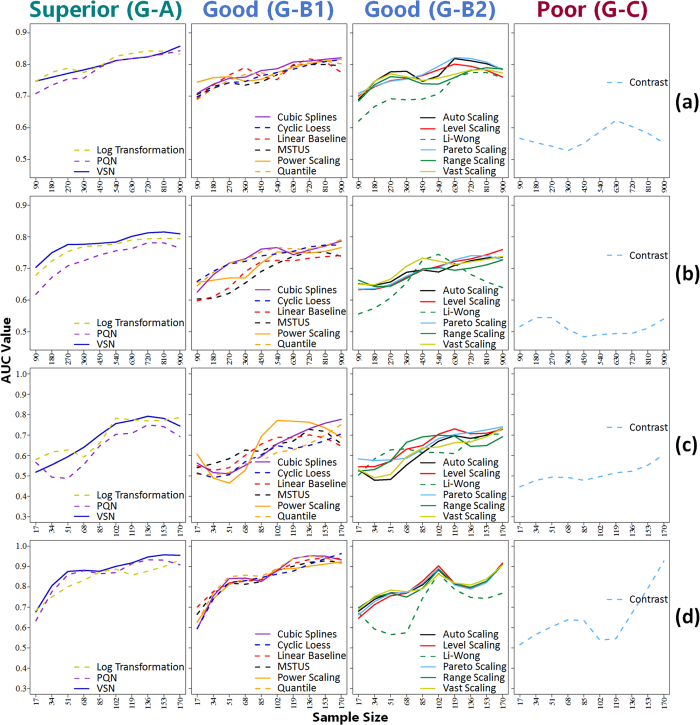
Figure 4.
Method groups categorized according to the normalization performances across various sample sizes based on four benchmark datasets: (a) MTBLS28 ESI+, (b) MTBLS28 ESI−, (c) MTBLS17 ESI+ and (d) MTBLS17 ESI−. (G–A) superior performance group; (G-B1) good performance group including methods occasionally classified to top green area of Fig. 3; (G-B2) good performance group including methods consistently staying in middle blue area of Fig. 3; (C) poor performance group. All lines were generated by the LOESS regression.

