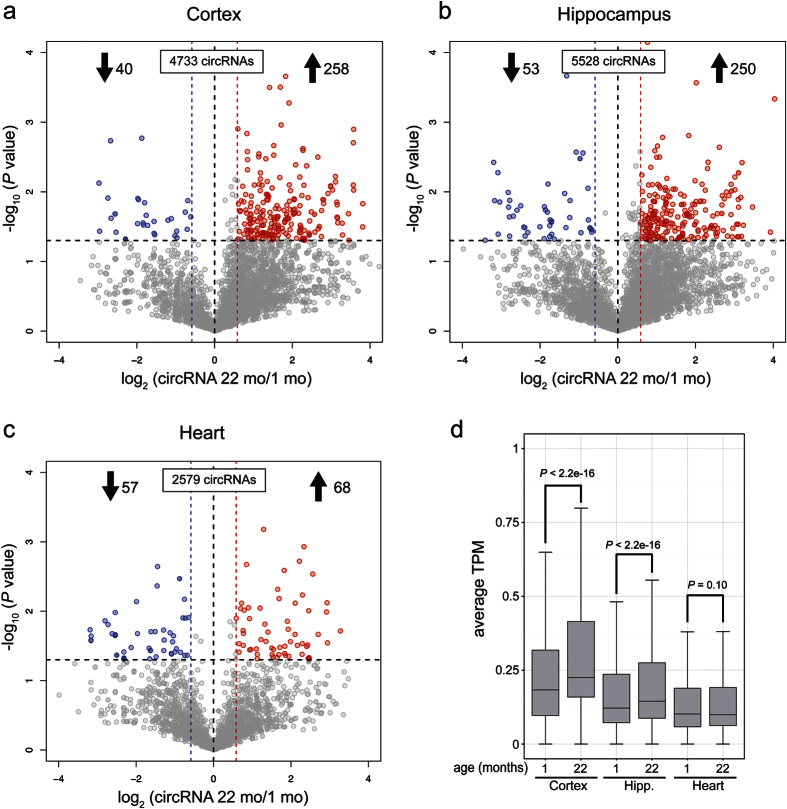
Figure 2. Differential circRNA expression between young (1 mo) and old (22 mo) tissues.
Volcano plots showing −log10 (P value) versus log2 fold difference in circRNA abundance in transcripts per million reads (TPM) between 22 mo and 1 mo tissues. circRNAs included in the analysis are those with 6 or more combined back-spliced reads in a given tissue. Red circles denote significant age-upregulated circRNAs whereas blue circles denote significant age-downregulated circRNAs (P < 0.05). Fold-change cutoff is set at 1.5. (a) Cortex circRNAs. More than 6-fold circRNAs are upregulated versus downregulated with age. Note the density of gray circles (non-significant changes) in the bottom right quadrant, indicating greater expression in 22 mo versus 1 mo. (b) Hippocampus circRNAs. Nearly 5-fold more circRNAs are upregulated versus downregulated with age. (c) Heart circRNAs. Note the reduced number of annotated circRNAs compared to brain regions and lack of age-upregulation trend. (d) Boxplots comparing circRNAs as measured by TPM among the three tissues. Hipp, Hippocampus. P value represents Wilcoxon rank sum test with continuity correction. n = 3 biological replicates for each tissue and age.

