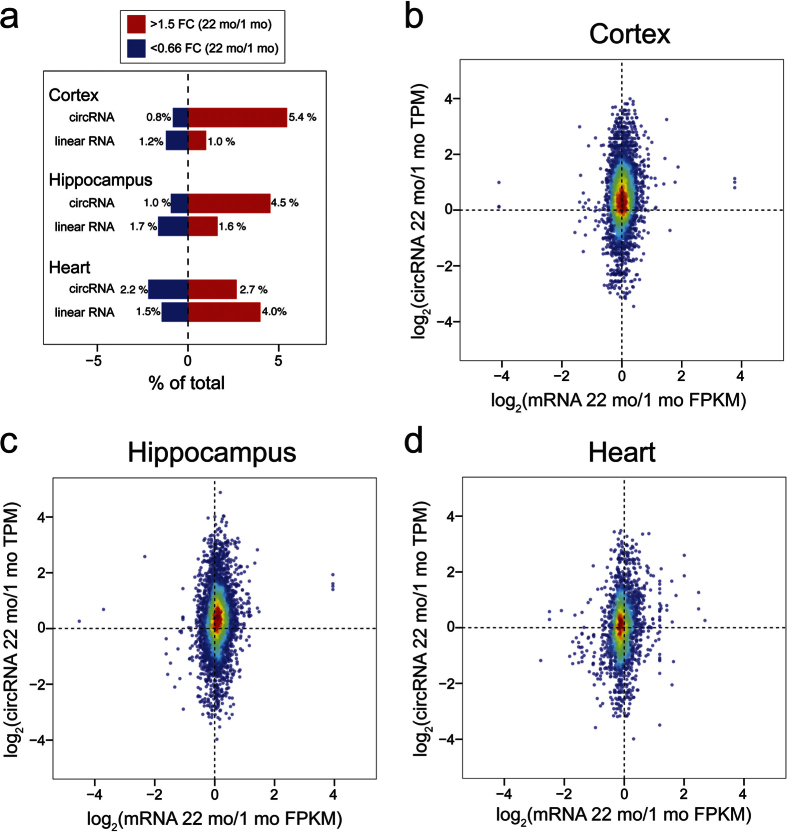
Figure 7. CircRNA increases during aging are largely independent of host gene expression.
(a) Barplots comparing the percentage of RNAs differentially expressed between 22 mo versus 1 mo samples from each tissue. FC = Fold Change. For cortex and hippocampus, the trend for age-upregulation is much stronger globally for circRNAs compared to linear RNAs. In contrast, a greater upregulation trend is seen for linear RNAs compared to circRNAs in heart. (b) Density plots comparing the log2 fold changes in circRNA transcripts per million (TPM) in 22 mo versus 1 mo samples on the Y-axis and the corresponding fold change FPKM of linear RNAs (22 mo versus 1 mo) from the corresponding gene on the X-axis. Cortex circRNA/mRNA density plot shows a strong trend for circRNA accumulation independent of cognate linear RNA expression from the same gene. (c) Hippocampus circRNA versus mRNA density plot shows similar trends as cortex. (d) Heart circRNA/mRNA density plot lacks circRNA age-upregulation trend.

