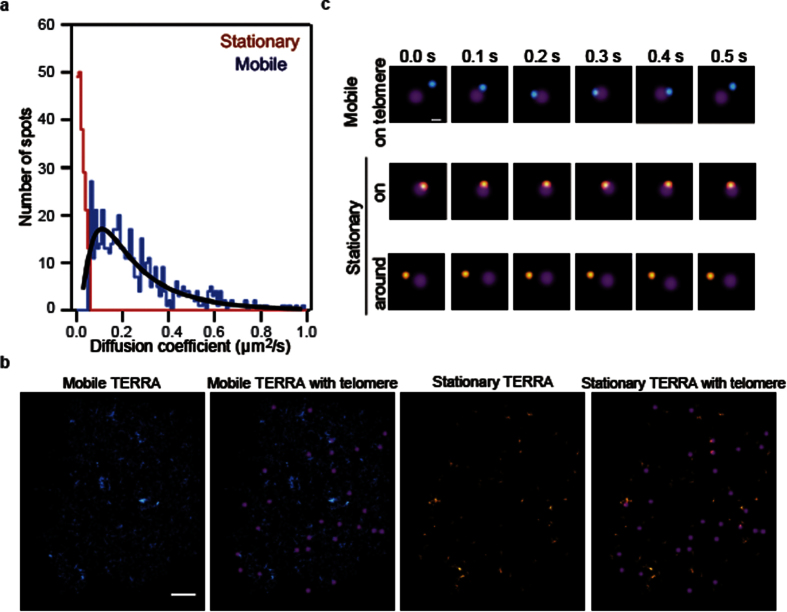
Figure 3.
Analysis of TERRA motion: (a) Histogram of the diffusion coefficient distribution of stationary TERRA (red, n = 200) and mobile TERRA (blue, n = 502) with a minimum track length of 7 frames (700 ms). Distribution of the diffusion coefficients of mobile TERRA was fitted with a lognormal function (black line). (b) Spatial distribution of TERRA in mobile and stationary phases. Mobile TERRA spots with D > 5.53 × 10⁻² μm2/s are shown in cyan. The spots in the stationary phase are shown in orange. The images are overlaid with the localization of telomeres (magenta). Scale bar, 2.0 μm. (c) Sequential images of stationary and mobile TERRA on or near a telomere. Scale bars, 0.5 μm.

