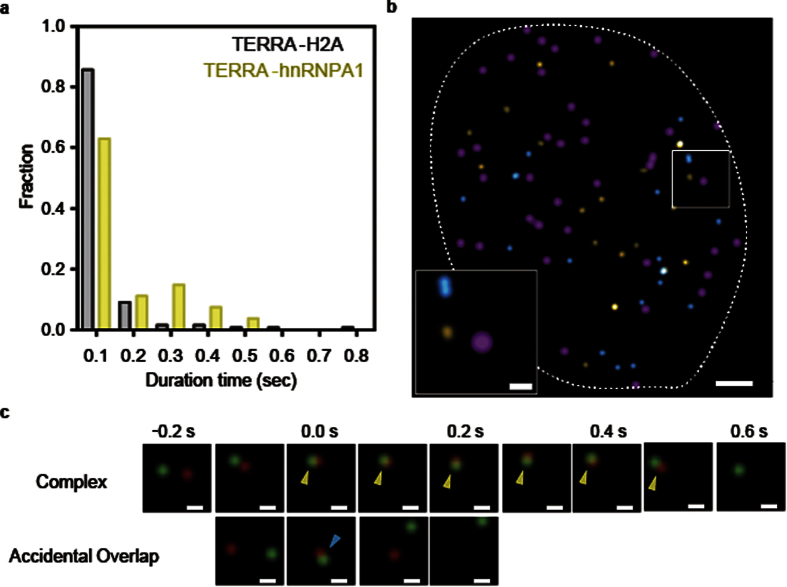
Figure 4. Definition of TERRA-hnRNPA1 complexes in living cells.
(a) Distributions of the duration of TERRA colocalization with hnRNPA1 (yellow) and H2A (gray). In all, 130 colocalization events were analyzed for the respective proteins. (b) Spatial distribution of the colocalization between TERRA and hnRNPA1 in the nucleus. TERRA-hnRNAP1 complexes are shown as yellow spots. Accidental overlaps are shown as cyan spots. Telomeres are represented by magenta spots. Scale bars, 2.0 μm and 0.5 μm (inset). (c) Sequential images of the colocalization of a TERRA spot (green) and an hnRNPA1 spot (red). Overlapping events that exceeded 0.2 s (yellow arrowheads) show TERRA-hnRNPA1 complex formation. Overlap sustained only for 0.1 s (cyan arrowhead) was regarded as an accidental overlap. Scale bars, 0.1 μm.

