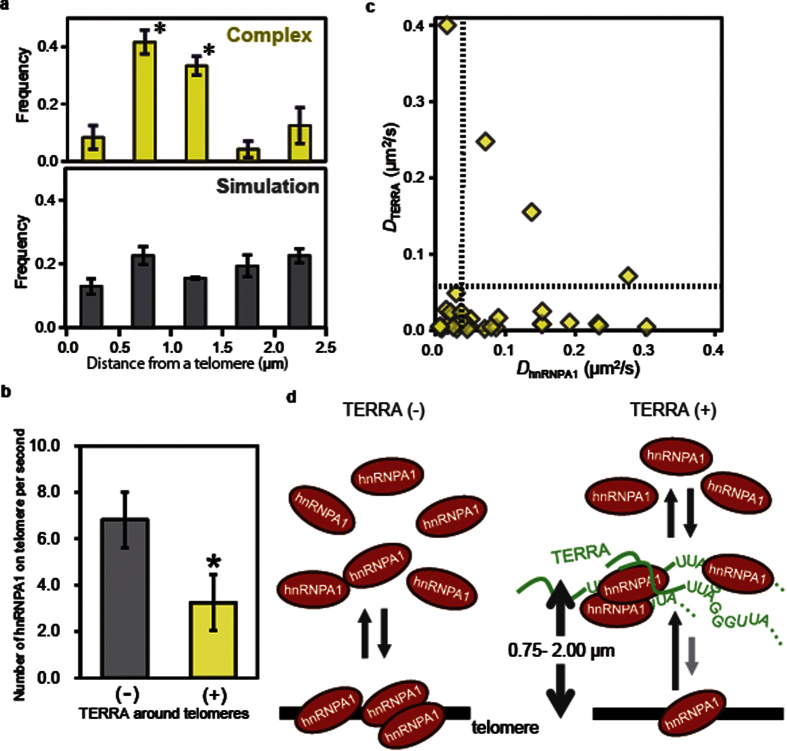
Figure 5. Relation between TERRA function and spatiotemporal dynamics of TERRA-hnRNPA1 complexes.
(a) Fraction of colocalized regions shown as a function of the distance from a telomere: yellow, TERRA-hnRNPA1 complex formation (* indicates p < 0.05, Student’s t-test); gray, simulated colocalization of TERRA with a freely diffusing molecule. (b) Correlation between hnRNPA1 localization to a telomere and TERRA accumulation around the telomere. The hnRNPA1 spots on telomeres were counted. During the observation, telomeres were categorized into two groups based on TERRA localization: TERRA localized to a telomere-neighboring area (TERRA around telomeres: +, n = 13) and no TERRA located around a telomere (TERRA around telomeres: −, n = 14). When TERRA was absent around a telomere, the number of hnRNPA1 occurrences was 6.8 spots/s, whereas this value was reduced by half when TERRA was present in the telomere-neighboring area (average: 3.2 spots/s, p < 0.05). (c) Scatter plot of the diffusion coefficients of TERRA and hnRNPA1 including a period of complex formation within the trajectory. Broken lines show thresholds between the stationary and mobile phases. (d) Model showing how TERRA regulates the localization of hnRNPA1 on a telomere. When TERRA is absent around a telomere (shown as a black bar), the binding of hnRNPA1 to the telomere is at equilibrium (left). When TERRA localizes to the telomere-neighboring region (0.75–2.00 μm from the telomere center), the locally accumulated TERRA captures hnRNPA1, shifting its equilibrium toward the telomere-unbound form (right).

