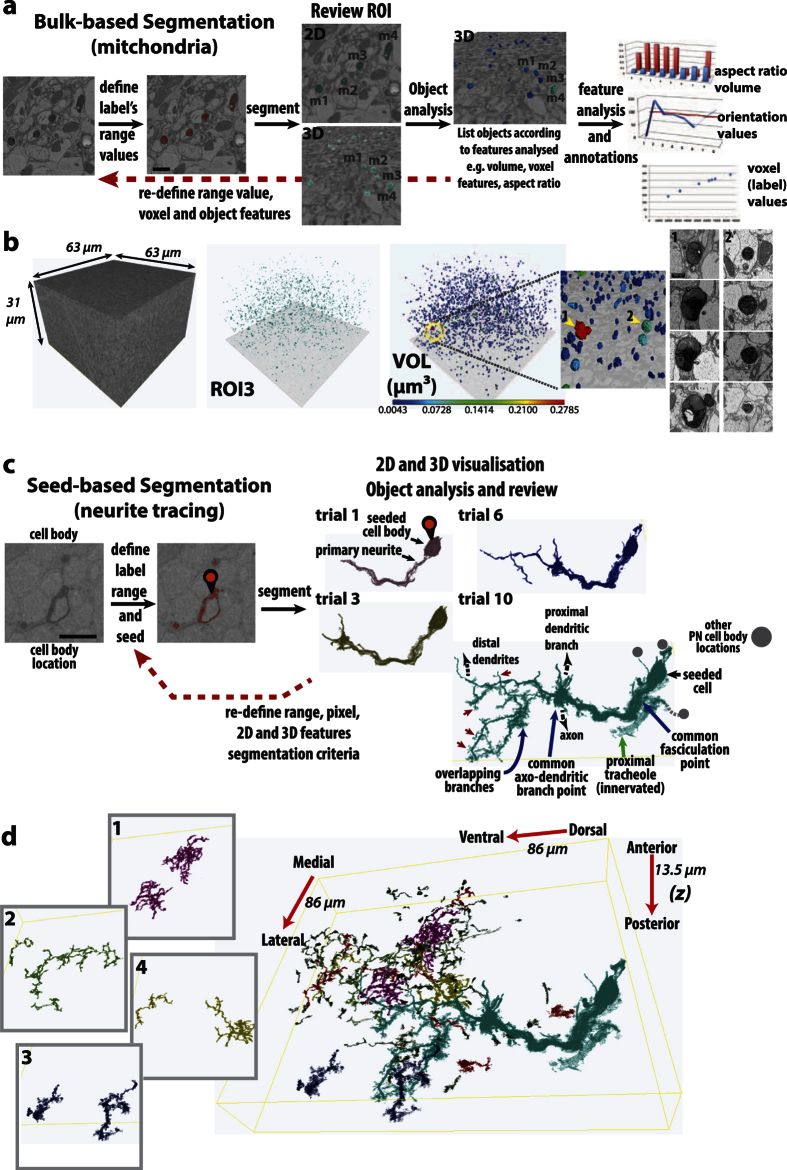
Figure 3. EM volume acquisition and computer-assisted segmentation of labelled volumes.
(a) Bulk segmentation was applied to the mitochondria-miniSOG labelled volume. Selected range values, corresponding to miniSOG contrast (red), correlated with the labeled mitochondria. Following initial segmentation, further filtering steps were applied (see Methods). The segmented subset (ROI3) can be examined in 2D and 3D. An Object Analysis procedure produces a mesh and lists the objects identified, with their analysed features. The volume feature for a subset of mitochondria (m1–4) is displayed. The graphs on the right are for illustration purposes only. Scale bar: 1 µm. (b) Summary of the mitochondria-miniSOG found within the acquired volume. The desired subset (ROI3, cyan-green) can be visualized in 3D and feature-displayed according to volume (VOL); colour-indexed blue–red, from the smallest (0.0043 μm3) to largest (0.2785 μm3), respectively. The ultrastructure of the largest mitochondrion (1) can be inspected further and compared against another (2). (c) Seed-based segmentation used to trace cytosol-miniSOG labeled neurites. Following range value selection, a seeding point (pin icon) was placed at the cell body, initiating the 3D segmentation process. Several trials were performed, whereby successively lower pixel intensities were sampled (trial/ROI 1–12). Trial/ROI1 traced primary neurites of the seeded cell body. Subsequent trials incorporated increasingly distal structures that included thin protrusions from dendrite segments (red arrowheads). Other traces represent overlapping segments. These ‘crossovers’ occur when several PNs are labeled; having common cell body locations, branching points or overlapping branch segments. Given its proximity and elevated contrast, a PN-innervated trachiole (green arrow) also becomes incorporated when low range values were used. Scale bar: 500 nm. Thus, two distinct events take place as increasingly lower values are sampled. Distal branches and terminal structures are included to the primary seed. However, non-related, overlapping neurites, cell bodies and contrasted structures can also become incorporated. (d) By seed segmentation, additional traces were also performed within the sub-volume, based on range values in Trial10. A subset of these neurites (1–4) is highlighted, and a composite (with the labeled PN cell) is shown on the right. The different colour highlights are used to aid visualization.

