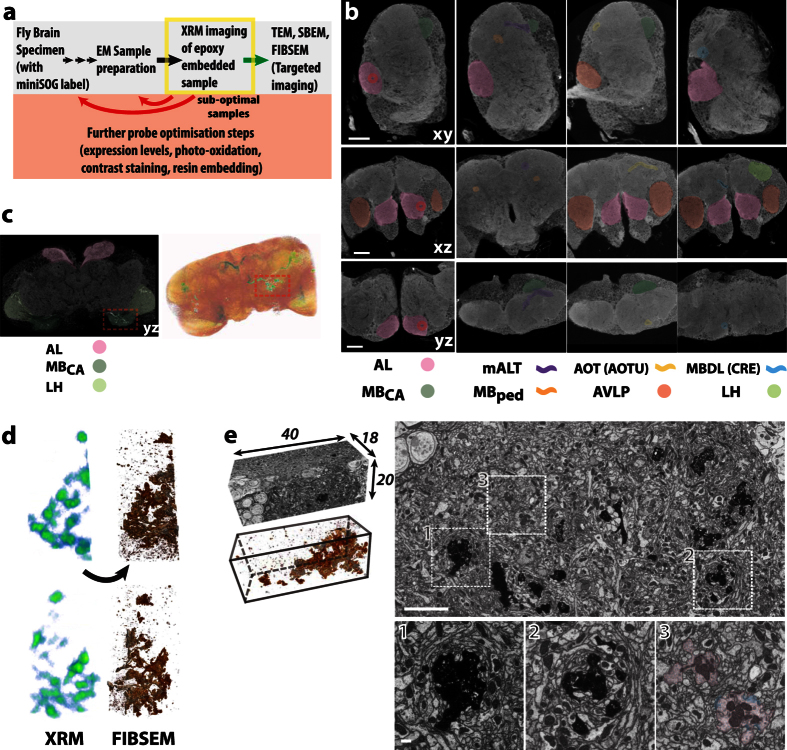
Figure 4. Whole fly brain miniSOG detection with correlative XRM-FIBSEM imaging.
(a) Schematic XRM-EM workflow used to screen fly brain samples optimized for heavy metal contrast and for targeted volume acquisition. (b) XRM tomograms were viewed from 3 virtual plane sections: xy, xz and yz. Many notable neuropil regions were discernable, highlighting the AL, MBCA, and anterior ventrolateral protocerebrum (AVLP). Visible tracts included the MBped, mALT the Anterior Optic tract (AOT) and the Median Bundle (MDBL). These were previously seen under light microscopy51. Each vertical set of 3 sections focuses on one particular region of the brain (AL, mALT, Anterior Optic Tubercle (AOTU) and Crepine (CRE),, respectively). Their slice coordinates are 603, 745, 560 and 1041 for XY; 413, 708, 470 and 434 for XZ; 903, 305, 317 and 611 for XZ. The inter-slice distance is 200 nm. Total volume dimension of the tomogram is 378 × 390 × 380 µm. Scale bars: 50 µm. (c) Left, A single virtual XRM section image of a fly brain specimen with cytosol-miniSOG labeled PNs. The AL, MBCA and LH locations are highlighted. Right, 3D volume rendered image of the entire specimen. When threshold is applied, the miniSOG contrast is recognisable, appearing in green and red, based on a blue-red color ramp for low-high signals. Note the uneven PN labeling on the left side of the brain. As such, the right MBCA, boxed in red, was selected for FIBSEM volume acquisition. (d) Left, Correlated threshold images from XRM (green-red) and FIBSEM (as copper-silver for low-high signal intensities) tomograms, shown from two perspectives. (e) Left: FIBSEM volume of MBCA (dimensions indicated in µm; voxel size: 10 nm isotropic). Below, thresholding reveals the miniSOG label. Right: Single xy section, with higher magnification from the inset regions, below. The high contrast, appearing as black, corresponds to miniSOG labeled PN terminals. A single non-miniSOG labelled PN terminal is highlighted, in pink, for comparison. Due to technical difficulties, it was not possible to obtain higher resolution of synapses from this specimen. However, some synaptic densities and vesicles are discernable, some of which are outlined in blue. This specimen was treated using ROTO only. Scale bars: 5 µm, 500 nm for inset.

