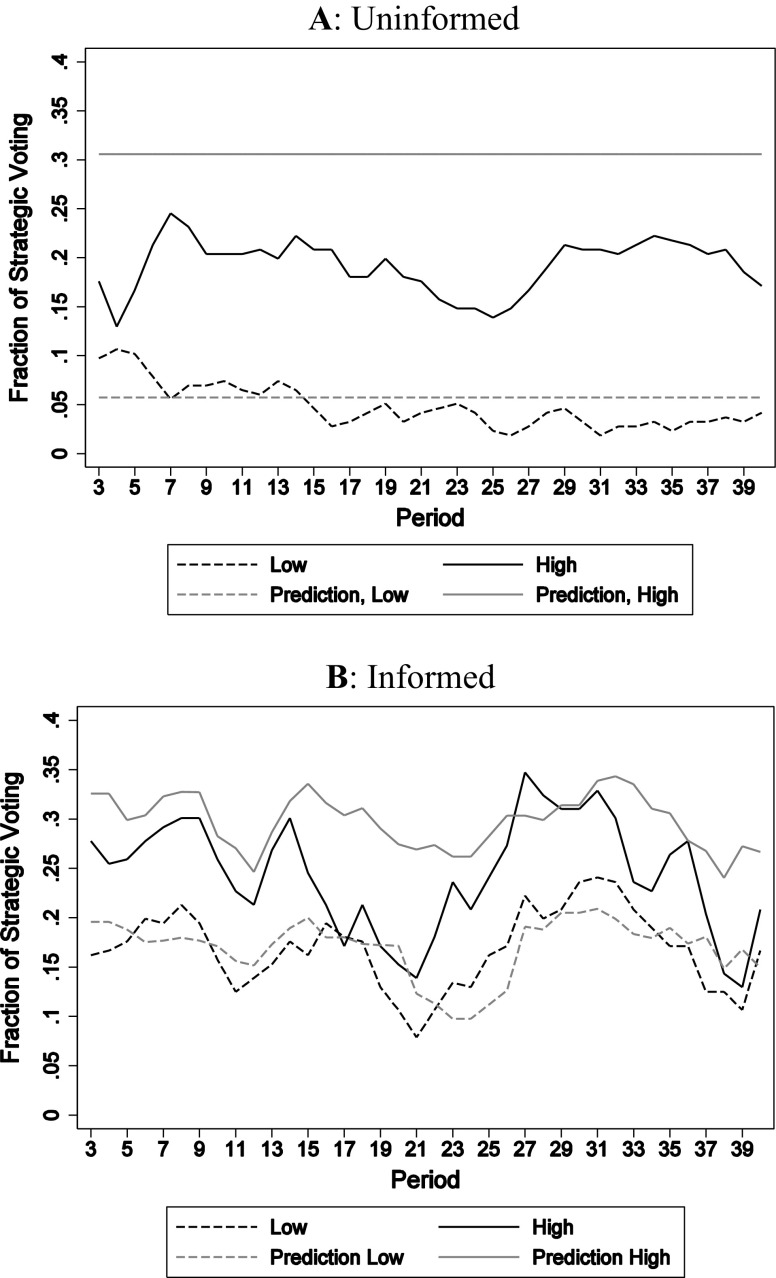
Fig. 5.
Experimental data and predictions. Lines show the 3-period moving average of the fraction of strategic votes in the uninformed (panel a) and informed (panel b) sessions. Dashed (solid) lines refer to low (high) intermediate values. Light lines show the 3-period moving average MLE predictions. Note that in the informed case (panel b) the MLE prediction in a round depends on the realized distribution of preferences

