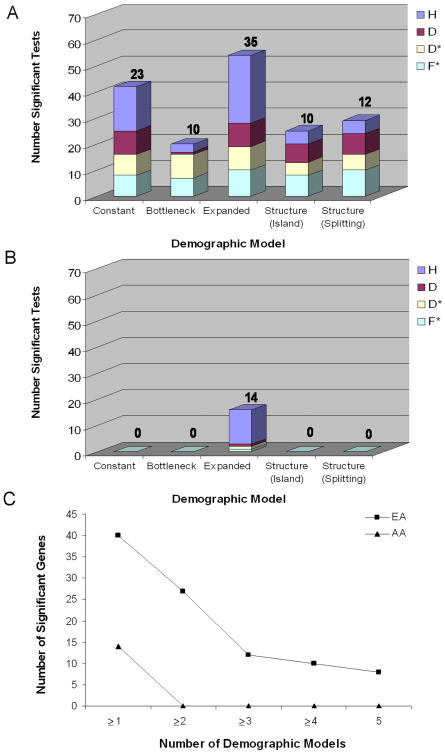
Figure 3. The Influence of Demographic History on Tests of Selection.
(A and B) The significance of observed values of Tajima's D (red), Fu and Li's D* (pale yellow), Fu and Li's F* (pale blue), and Fay and Wu's H (dark blue) were reassessed for each best-fit demographic model in European-Americans (A) and African-Americans (B). Results from the standard neutral model (Constant) are shown for comparison. The number of significant genes for each demographic model is noted above each category in (A) and (B). For example, there were a total of 19 significant test statistics across all four tests of neutrality assuming a bottleneck model for Europeans, which define ten unique genes. Therefore, each gene is supported by approximately two (19/10) tests of neutrality.
(C) The distribution of the number of significant genes across the five demographic models in European-Americans and African-Americans. For example, in European-Americans, 40 genes were significant in at least one of the demographic models, and 27 genes were significant in at least two of the demographic models.

