
Fig. 1.
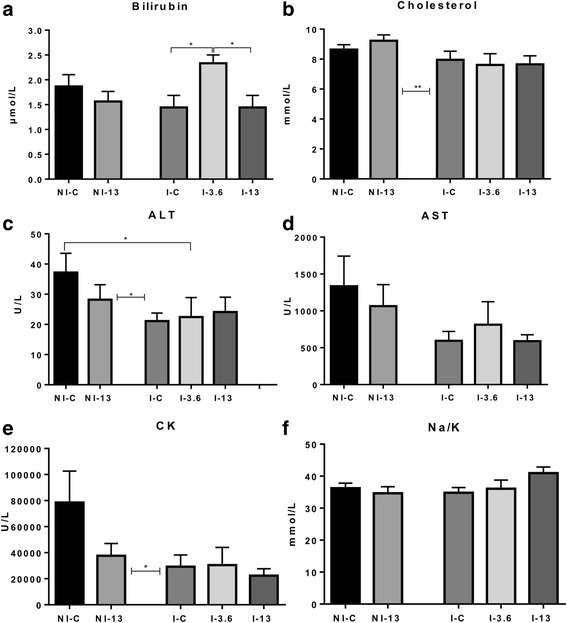
Blood plasma levels (mean ± SEM) of total bilirubin (a), cholesterol (b), alanine aminotransferase (ALT) (c), aspartate aminotransferase (AST) (d), creatine kinase (CK) (e) and sodium (Na+) to potassium (K+) ratio (Na/K) (f) in not infected (NI) fish exposed to 0% of GLs (NI-C) and an extreme dose of GLs (NI-13) and infected fish (I) fed feed with 0% of GLs-containing raw ingredient (I-C), 3.6% (I-3.6) and 13% (I-13). Blood plasma profiling was performed on 15 individuals from NI-C and 16 individuals from NI-13 in Trial 1, and 9 fish from each of the groups in Trial 2. Asterisks shown between NI and I groups refer to statistical differences of NI-C and NI-13 as one group vs I-C, I-3.6 and I-13 as the other group. Asterisks shown above bars denote significant differences between two groups. *P < 0.05, **P < 0.01