
Fig. 2.
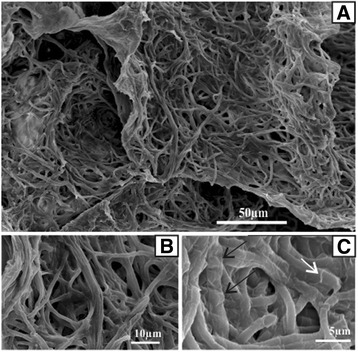
Scanning electron photomicrographs. a Global view of mat network, scale bar = 50 μm. b Detailed view of fine and cylindrical trichomes (0.7-1.3 μm of diameter), scale bar = 10 μm. c Capsular polysaccharides (CPS) at the cell surface are indicated by arrowheads and RPS that have been released are indicated by white arrow, scale bar = 5 μm