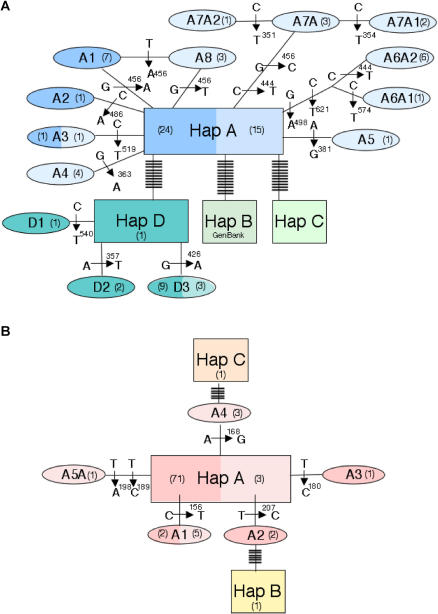
Figure 3. Haplotype Networks for M. montanus and T. talpoides .
Haplotype networks (Clement et al. 2000) for (A) M. montanus and (B) T. talpoides from Lamar Cave fossils and from modern specimens collected within a 400-km radius of Lamar Cave. Haplogroups for both species are indicated as A–D. Each haplogroup within a species is defined by at least 3% sequence divergence within the cytochrome b fragment. M. montanus haplogroup B is taken from GenBank. Haplogroup C is a sample from outside our 400-km radius (NK5897, Mono County, California; Museum of Southwestern Biology #53376). Light shading shows modern samples; dark shading shows fossil samples; bars indicate substitutions; cytochrome b sequence positions are indicated by number above base designation. Numbers within parentheses indicate sample sizes for each haplotype.

