Fig. 7.

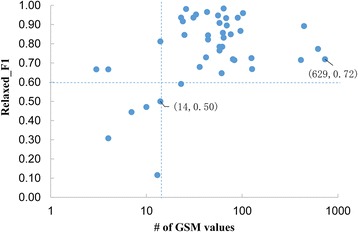
Scatter plot showing the relationship between Relaxed_F1 scores and frequency of character value occurrence in GSM for each of the 42 characters. The axis of the number of GSM values is log-transformed

Scatter plot showing the relationship between Relaxed_F1 scores and frequency of character value occurrence in GSM for each of the 42 characters. The axis of the number of GSM values is log-transformed