Figure 2. Blue mussel (Mytilus sp.).
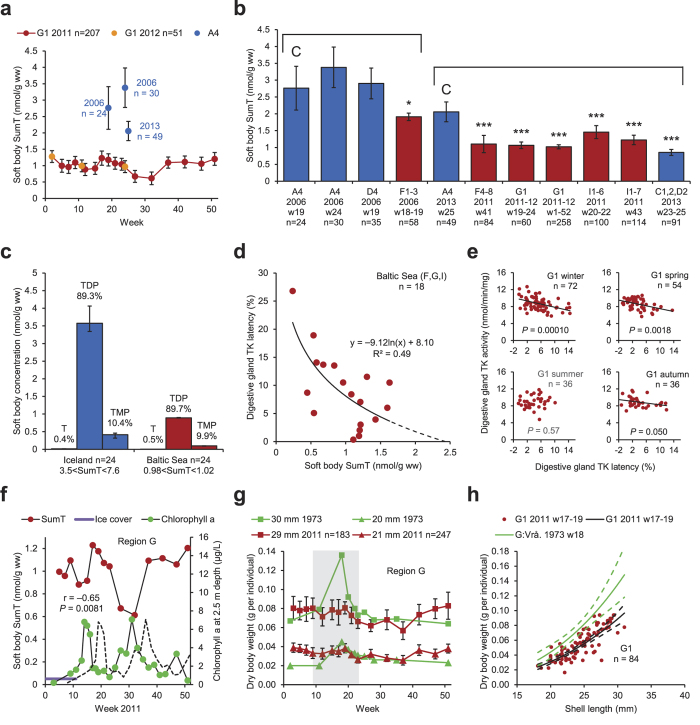
(a) Soft body SumT at G1 in the County of Södermanland (red or orange) and at A4 in Iceland (blue). (b) Soft body SumT in Iceland (blue) and the Baltic Sea area (red). ANOVA-type regression model. (c) Concentration and proportion soft body T, TDP, and TMP in Icelandic (blue) specimens with high SumT and Baltic Sea (red) specimens with low SumT. (d) Digestive gland TK latency and soft body (except digestive gland) SumT in the Baltic Sea. (e) Digestive gland TK activity and latency at G1 during four seasons. (f) Soft body SumT at G1 (red) and chlorophyll a in the water at G2 (green) in the County of Södermanland. Dashed line: five weeks delayed chlorophyll a curve. (g,h) Dry body weight in specimens of different lengths at G1 2011 (red/black, this investigation) and Vrångskär in the County of Södermanland 1973 (green, adapted from Kautsky16). (g) The shaded area indicates the reproductive period (March 1–June 10) defined by Kautsky16. (h) Week 17–19. Dashed lines: 95% CI. • Bars: arithmetic means. Whiskers: 95% CI. C: control. Group comparisons are indicated by brackets.

