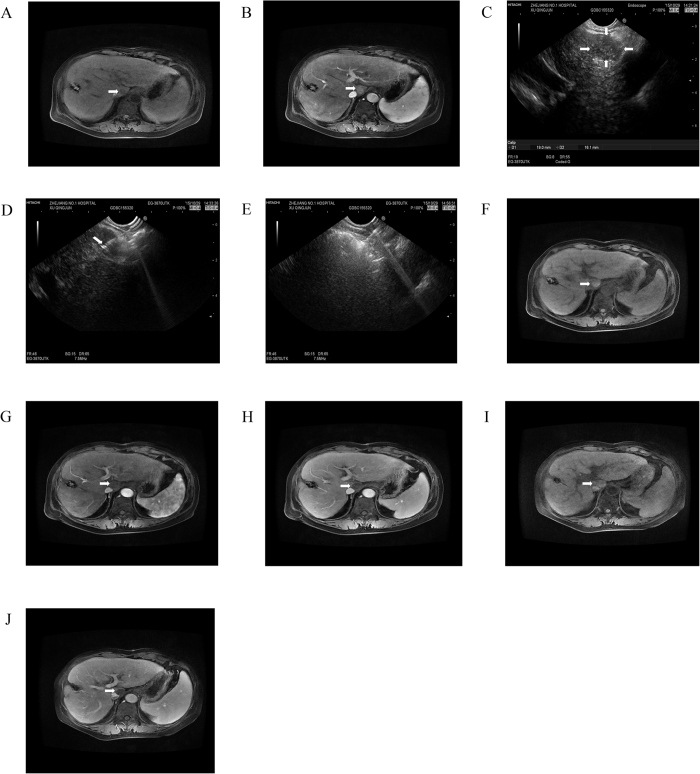
Figure 3. EUS-guided anhydrous ethanol ablation for lesions in liver caudate lobe.
MRI imaging in liver caudate lobe showed a lesion of low T1 signal intensity (A) (arrowhead) and significant enhancement in arterial phase (B) (arrowhead). (C) at liver caudate lobe EUS scan showed a well-defined hypoechoic 1.9*1.6 cm lesion (arrows). (D) It indicated that 22G biopsy needle with EUS guidance was inserted into the lesion along with the needle sheath (arrowhead), and (E) diffuse increase in echogenicity covering the whole mass after the percutaneously punctured injection of anhydrous alcohol. After 1 month follow-up, MR scan was seen high T1-weighted signal intensity (F) (arrowhead) and no obvious enhancement during arterial (G) (arrowhead) and substance phase (H) (arrowhead). After 15 months follow-up, it showed high T1-weighted signal intensity (I) (arrowhead) and contrast material-enhanced MR images showed completed ablation without enhanced lesions (J) (arrowhead).

