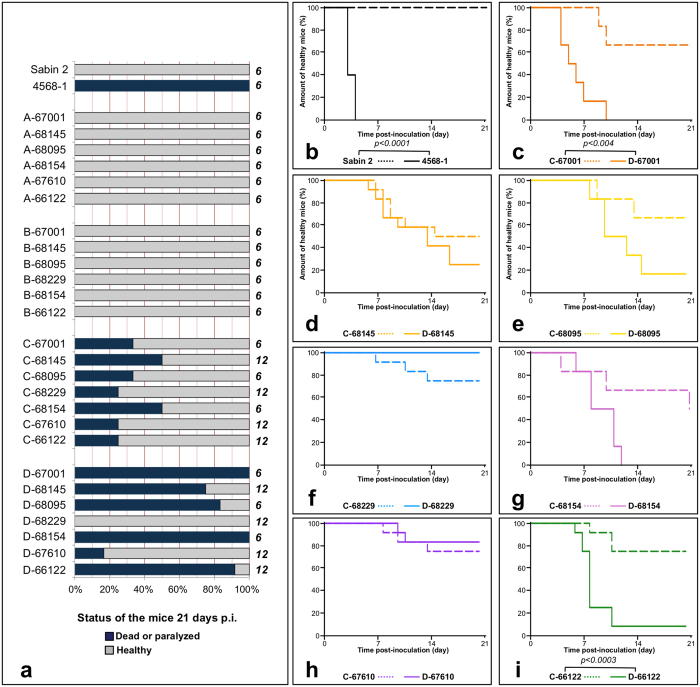
Figure 5. Neurovirulence in transgenic mice.
Mice were inoculated intracerebrally with the viruses. (a) Proportion of dead or paralyzed mice 21 days after inoculation. On the right of each bar, the number of mice inoculated is indicated. (b) Survival curves obtained for Sabin 2 and ISR4568-1, a highly neurovirulent cVDPV used as a positive control. (c-i) Survival curves obtained for viruses with genomic patterns C and D. The survival curves were compared in log-rank tests; p-values are indicated if < 0.05.

