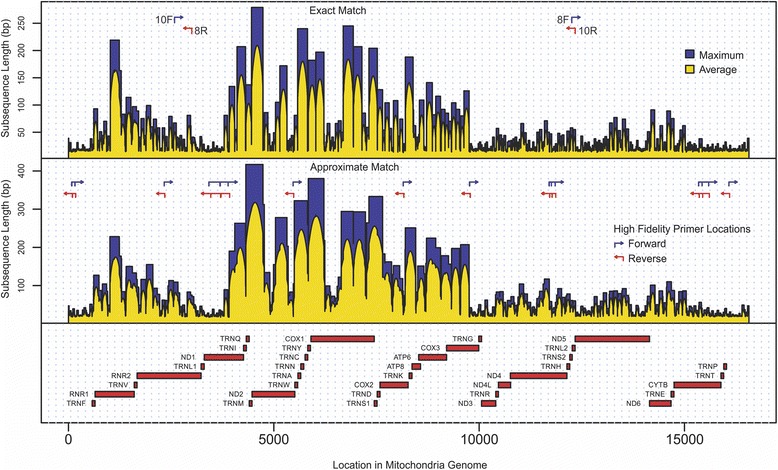
Fig. 1.

The nucleotide-by-nucleotide perfect and approximate match nDNA interference maps for the mitochondrial genome. 8F, 8R, 10F, and 10R are locations of long-range PCR primers used in Li et al. study [27]. “Maximum” (colored in blue) represents the length of the longest identified LCS (for exact match map) or LSS (for approximate match map) that covers an individual nucleotide position in mtDNA. “Average” (yellow) represents the average length of the identified LCS or LSS that covers an individual nucleotide position in mtDNA
