Fig. 3.

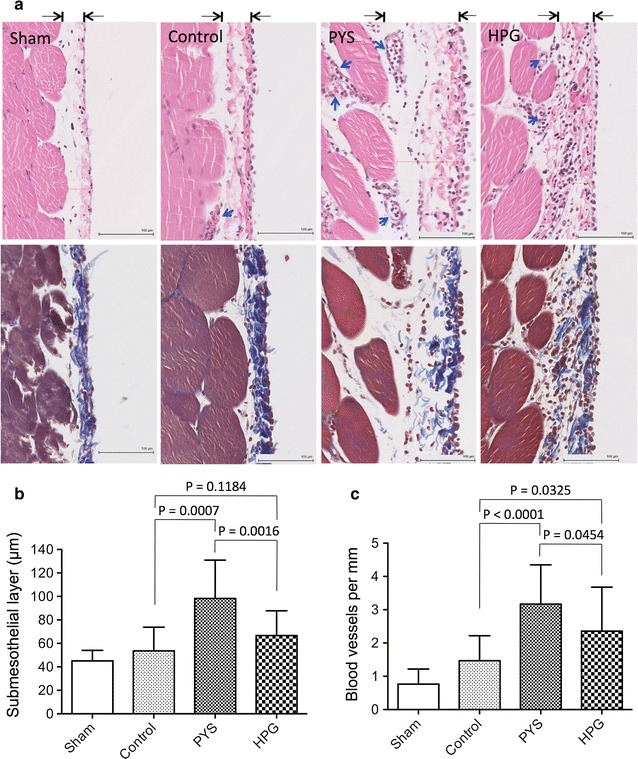
HPG has better protection of peritoneal membrane structure. At the end of 3-month treatment, peritoneal tissue sections (2 sections/rat) were taken from rats (Sham: n = 3; Control: n = 7; PYS: n = 7; HPG: n = 8) after 4 h of PYS exposure for UF test. a A typical microscopic image of the peritoneal tissue sections in each group, and were stained using either H&E (top panel) or Masson’s trichrome method (bottom panel). H&E stain showing the thickness of the peritoneal membrane indicated by the distance between two arrows. Nuclear dark blue stain cellular infiltrates; blue arrows blood vessels; black thin bar 100 µm. Masson’s trichrome stain showing collagen deposition (dark blue). b The thickness of submesothelial layer in each tissue section was measured using the Digital Image Hub software. Data were presented as mean ± SD of each group, and were statistically analyzed using two-tailed t test. c Angiogenesis in the peritoneal membrane was represented by the number of the blood vessels and capillaries per millimeter. Data were presented as mean ± SD of each group, and were statistically analyzed using two-tailed t test
