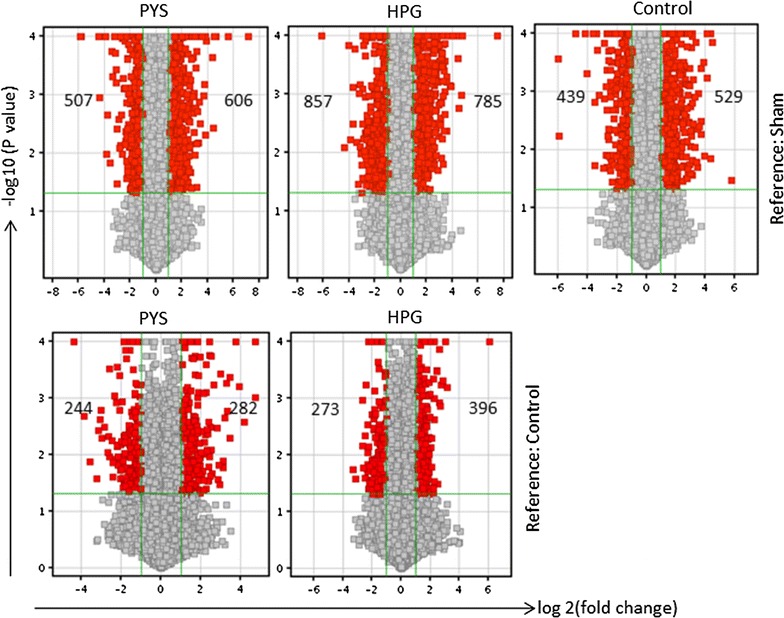
Fig. 5.

Changes in transcriptome in the PM of rats receiving daily i.p. injection of electrolyte Control, PYS or HPG solution. Venn diagram analysis of microarray data (four separate samples in each group, n = 4; one rat in Sham provided two samples) of Control, PYS or HPG was performed as compared to those of Sham or of PYS or HPG as compared to Control using the Agilent Gene Spring software. Only the transcripts that were significantly changed (p ≤ 0.05; FC ≥ 2.0) as compared to Sham or Control group were included and presented in this analysis. Top panel The changes of gene expression in Control, PYS or HPG using Sham as a reference. Bottom panel The change of gene expression in PYS or HPG using Control as a reference. Positive FC up-regulated, negative FC down-regulated
