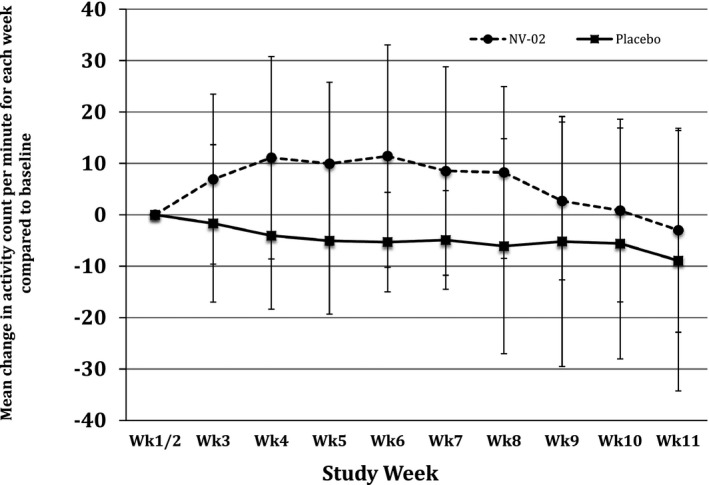
Figure 2.

Plot of percentage change from baseline (average of weeks 1 and 2 activity, before the antibody or placebo being administered) in mean weekly activity counts (originally expressed as average activity count per minute over the week) by group (treatment/placebo), for each week of study.
