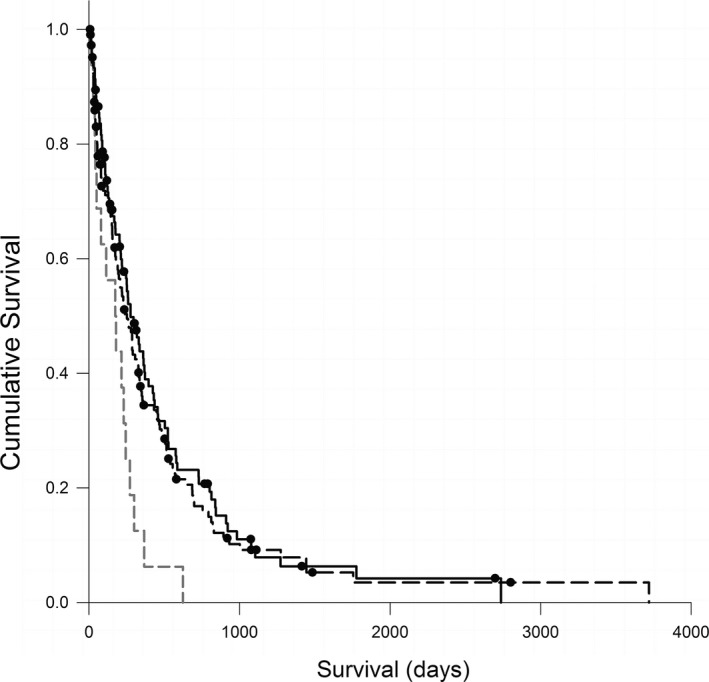
Figure 1.

Kaplan‐Meier survival curves comparing survival time (days) for 270 dogs with lymphoma in different body condition score categories at the time of diagnosis—overweight (n = 106, black dashed line); ideal weight (n = 148; solid black line); and underweight (n = 16; gray dashed line), P = .017. Circles represent censored cases.
