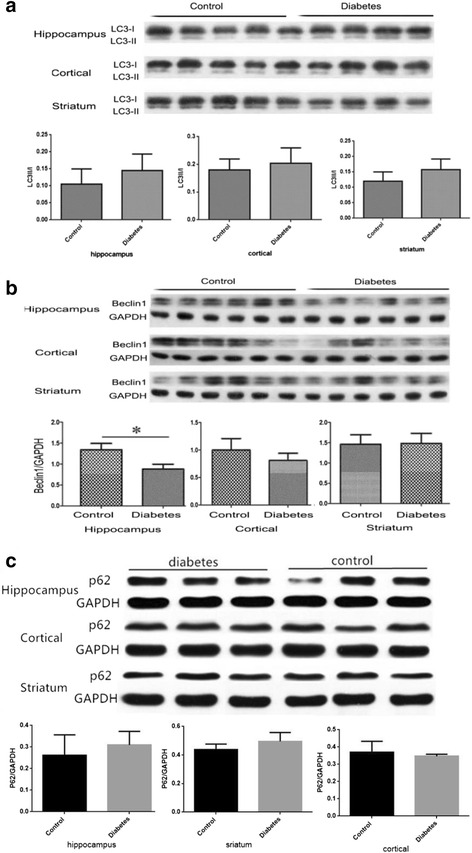
Fig. 5.

a The protein levels of LC3II/LC3I in Hippocampus, Cortex and Striatum were measured by Western Blotting, The graphs showed the relative density of LC3-II to LC3-I. (n = 4 for diabetic group, n = 5 for control group). b The protein levels of Beclin1 in Hippocampus, Cortex and Striatum were measured by Western Blotting, The graphs showed the relative density of Beclin1 to GAPDH. Note that the protein level of Beclin1 decreased significantly in the hippocampus of diabetic mice (*P < 0.05 n = 4 for diabetic group, n = 5 for control group). c The protein levels of p62 in Hippocampus, Cortex and Striatum were measured by Western Blotting, The graphs showed the relative density of p62/GAPDH
