
Fig. 3.
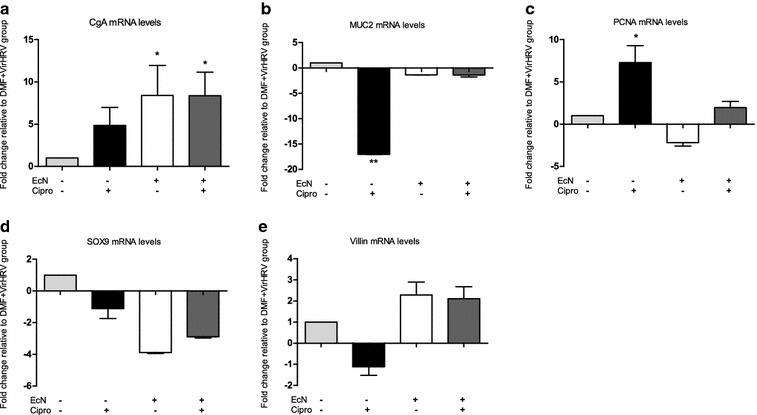
Relative mRNA levels of CgA (a), MUC2 (b), PCNA (c), SOX9 (d) and villin (e) in DMF + Cipro + VirHRV (n = 6), DMF + EcN + VirHRV (n = 3), DMF + Cipro + EcN + VirHRV (n = 4) groups measured by RT-PCR, normalized to β-actin gene and expressed as fold change relative to the DMF + VirHRV group (n = 6), which was normalized as 1. Graphs represent means ± SEM. (*P < 0.05, **P < 0.01, relative to DMF + VirHRV group)