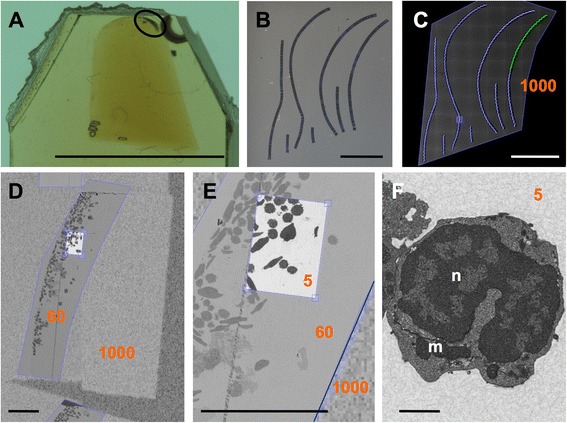
Fig. 3.

Hierarchical imaging. Arrays of several ribbons are sectioned from resin blocks (a) here containing a pellet of zebrafish immune cells (circle) and deposited on silicon wafers (b). Overview of array imaged in a FESEM with 1000 nm pixel size (c), whole pellet in one section imaged with 60 nm pixel size (d), ROI imaged with 5 nm pixel size (e), and zooming in to one cell in this ROI (f). Numbers in orange indicate pixel size in the respective ROI. Note the clearly visible change in pixel size at the borders (blue frames) of the ROIs in D, E. Scale bars: 5 mm in A-C, 50 μm in D, E, 1 μm in F; n = nucleus, m = mitochondria
