
Fig. 1.
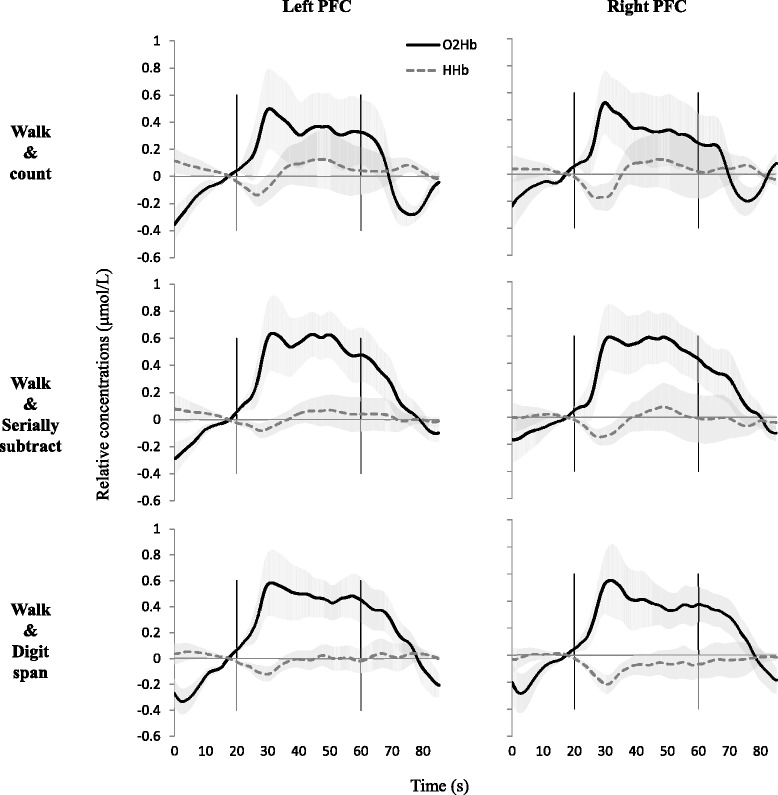
fNIRS signal time courses for each task. Average time courses of oxygenated hemoglobin (O2Hb: dark, solid lines) and deoxygenated hemoglobin (HHb: lighter, dotted lines) of all subjects (N = 12) for left and right prefrontal cortices, mean ± sem. Vertical black lines indicate start and end of task performance. PFC prefrontal cortex