
Fig. 2.
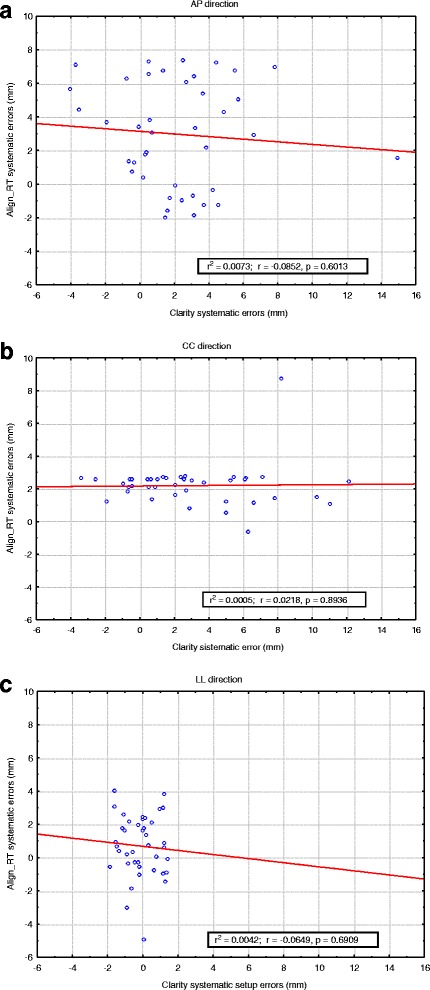
The graphs (a, b, c) show that the systematic errors detected by AlignRT and Clarity are not correlated. The p values for the linear regression resulted 0.6013, 0.8936, and 0.6909 respectively for AP, CC, and LL direction
Official websites use .gov
A
.gov website belongs to an official
government organization in the United States.
Secure .gov websites use HTTPS
A lock (
) or https:// means you've safely
connected to the .gov website. Share sensitive
information only on official, secure websites.
The graphs (a, b, c) show that the systematic errors detected by AlignRT and Clarity are not correlated. The p values for the linear regression resulted 0.6013, 0.8936, and 0.6909 respectively for AP, CC, and LL direction