
Fig. 1.
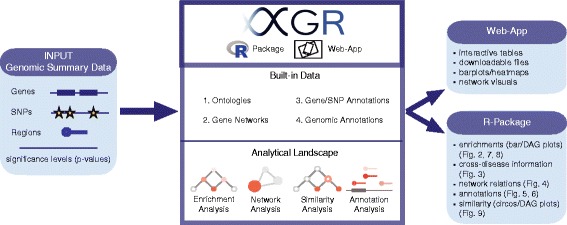
Schematic workflow of XGR: achieving enhanced interpretation of genomic summary data. This flowchart illustrates the basic concepts behind XGR. The user provides an input list of either genes, SNPs, or genomic regions, along with their significance levels (collectively referred to as genomic summary data). XGR, available as both an R package and a web-app, is then able to run enrichment, network, similarity, and annotation analyses based on this input. The analyses themselves are run using a combination of ontologies, gene networks, gene/SNP annotations, and genomic annotation data (built-in data). The output comes in various forms, including bar plots, directed acyclic graphs (DAG), circos plots, and network relationships. Furthermore, the web-app version provides interactive tables, downloadable files, and other visuals (e.g. heatmaps)