
Fig. 5.
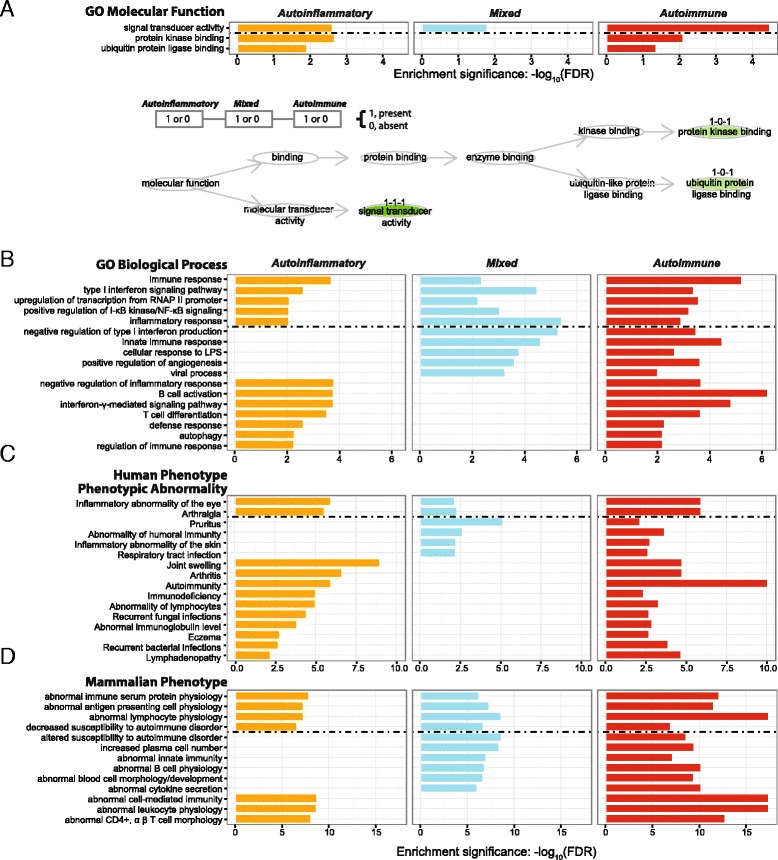
Functional and phenotypic annotation analysis of genes harbouring GWAS SNPs for three immunological disease categories. Visualised in aside-by-side bar plot and/or DAG plot using functional ontologies, including a GO molecular function and b GO biological process; and using phenotype ontologies in human and mouse, including c human phenotype phenotypic abnormality, and d mammalian phenotype